Monitoring and Visualization
Revision | Date | Description |
|---|---|---|
| 24.07.2024 | Init Changelog |
Introduction
As the organization grew, the need for monitoring infrastructure, applications and processes increased.
The Current solution with monitor all with only Zabbix Server was not enough. Creating small instances of Prometheus Servers connected to corresponding Grafana on every K8s cluster was hard to maintain and use.
DevOps and SRE teams work hard to prepare simple, stable and high available monitoring and visualization stack. And we did it…
Grafana x Prometheus x Thanos
To meet expectations we need to use few tools:
Grafana - for data visualization and alert management.
Prometheus - as data (metrics) collector.
Thanos - as data (metrics) storage and query tool (instead of Prometheus Server).
Along with this apps deployed on Kubernetes, we used some AWS Services as additional components for them:
AWS RDS Aurora - as Grafana storage and backup solution.
AWS S3 - as all metrics storage.
Of course, there is more - lot of datasources included, like:
Part of stack | Not part of stack |
|---|---|
Node Exporter | Zabbix Servers |
Kube State Metric | Databases |
AWS (as connection with Grafana) |
Web interfaces
There are two (yes, only two) web interfaces for all apps deployed within stack:
Application | URL | Auth | Environment |
|---|---|---|---|
Grafana | https://grafana.blue.pl |
|
|
Thanos | https://prometheus.blue.pl |
|
|
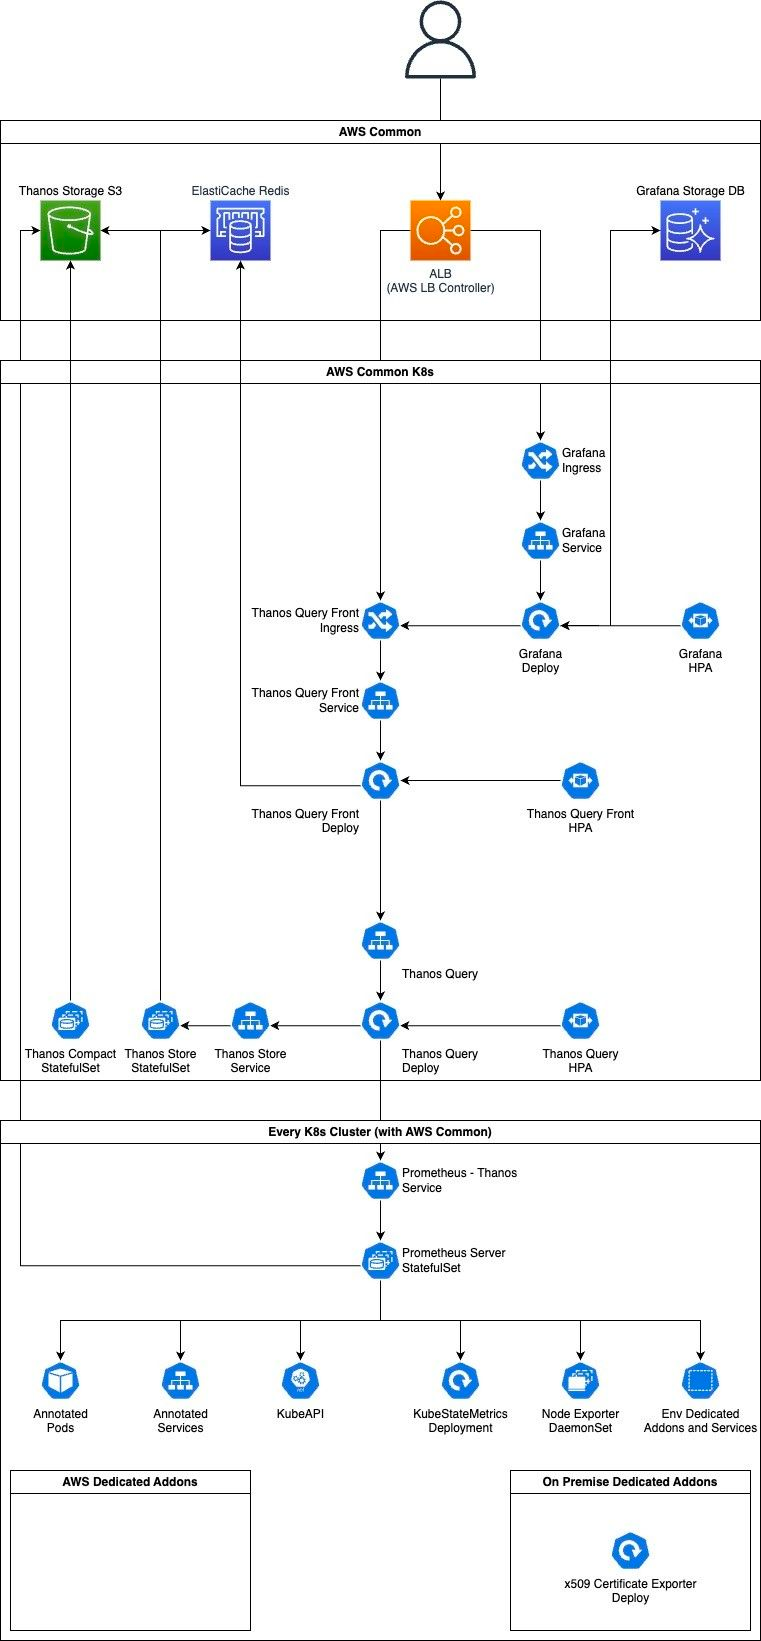
You may ask, “Why Thanos app is under ‘prometheus’ address?”. Here's the answer:
Infrastructure diagram

Grafana
Wikipedia.com says that Grafana is open source (nothing is the best price) analytics and interactive visualization web application. It provides charts, graphs and alerts when connected to supported data sources. As a visualization tool, Grafana is a popular component in monitoring stacks, often used in combination with time series databases (like Prometheus), monitoring platforms (like Zabbix), SIEMs (like Elasticsearch and Splunk) and other data sources (like AWS infrastructure or databases).
Official documentation: Grafana open source documentation
High availability
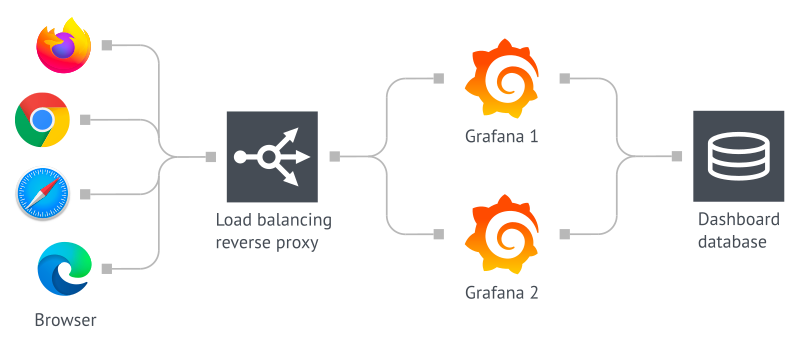
To achieve high availability, we use a shared database to store users, dashboards and other persistent data between replicas.

As a database, we use AWS RDS Aurora Instance with parameters:
AWS Account | Engine | Version | Backup | Backup retention |
|---|---|---|---|---|
| Aurora PostgreSQL |
| Everyday ~4.00 AM |
|
For managing Grafana instances, we use the official Helm Chart with Pod affinity based on AWS Availability Zone and autoscaling setup:
Min instances | Max instances | Scaling target |
|---|---|---|
2 | 6 | CPU: 75% |
Basic data sources
Grafana visualizes data based on configured Data sources. Some of them are treated by Admins as basic.
Name | Type | uid | Description |
|---|---|---|---|
Prometheus Global | Prometheus |
| Thanos Query instances. Stores metrics collected from K8s and other, configured services (like Kafka). |
Zabbix | Zabbix |
| Zabbix production instance (https://zabbix.blue.pl). |
Zabbix - K8s | Zabbix |
| Zabbix production instance deployed on K8s cluster (https://zabbix-k8s.blue.pl). |
Zabbix - Test | Zabbix |
| Zabbix test instance deployed on K8s cluster (https://zabbix-k8s-test.blue.pl). |
Additional data sources
To add a new Data source, you need to create a task on ITS Service Desk for DevOps team.
Migration from old Grafana instance
You can migrate your dashboards and alerts from old Grafana independently — manually or with Import function (from JSON model).
But if you don’t want to migrate it or just have no idea how to do it - create a task on ITS Service Desk for DevOps team. Remember - DevOps team is small, so the priority for this task will be low, and you cannot change it.
Prometheus
Prometheus is an open-source (free is the best price!) systems monitoring and alerting toolkit. It collects and stores metrics as time series data, i.e., metrics information is stored with the timestamp at which is recorded, alongside optional key-value pairs called labels.
Official documentation: Overview | Prometheus
High Availability
Prometheus does not support native HA mode. This means that each instance (Pod) is an independent Prometheus Server that collects all metrics and stores them on own storage. Scaling it creates duplication of every data that is marked to collect.
So… How we achieve high availability? Using Thanos systems!

All Thanos docs are under the Thanos section in this document. What you need to know here is that:
every Prometheus Server Pod is built from three containers:
prometheus-server- standard container, which collects all data and makes prometheus things.config-reloader- monitors changes on ConfigMap with Prometheus configuration and reload it on prometheus-server.thanos-sidecar- takes all metrics fromprometheus-servercontainer and sends it to S3 Storage and Thanos Query (and from there - to Grafana).
there are two Pods per cluster.
every Prometheus Instance has configured external label to use by Thanos for ‘clustering’ (and deduplicating data).
collected metrics have a short lifetime - after 2h are sent to S3 Storage (and are ‘managed’ by Thanos components) and after 8h are deleted from local storage.
Clusters
Every Kubernetes cluster has own Prometheus instances setup connected to stack. As mentioned above - there are external labels on each that makes them work in HA mode using Thanos. But it’s not only label added - there is a label to show on which Kubernetes cluster metric was collected.
In fact, both labels (kube_cluster and prom_cluster) have the same value (for now!). But only kube_cluster is shown as default in queries - Thanos Query component (https://prometheus.blue.pl) doesn’t show replication label (prom_cluster) in a query result as default.
So? What do I need to do if I want to check metrics form, e.g., AWS Staging EKS cluster? Use kube_cluster="aws-staging" metric label in your queries.
Here you have list of all clusters and their name in kube_cluster label:
Cluster |
|
|
|---|---|---|
AWS TST EKS |
|
|
AWS STG EKS |
|
|
AWS PRD EKS |
|
|
AWS COMMON EKS |
|
|
ON PREMISE PRD |
|
|
ON PREMISE PRD (old) |
|
|
ON PREMISE PRD CARDS |
|
|
ON PREMISE STG (microk8s) |
|
|
Additional targets
If you want to add additional targets to collect metrics from, you need to:
if it’s an application deployed on Kubernetes, you need to annotate Pod or Service:
prometheus.io/path: <http_path>- path where your application exposes metrics.prometheus.io/port: <http_port>- port where to connect on specific part to get metrics.prometheus.io/scrape: true- set metrics collection from annotated resource.
if it’s not application deployed on Kubernetes, you need to create a task on ITS Service Desk for DevOps team with valid configuration for your job.
Thanos
Thanos provides a global query view, high availability, data backup with historical, cheap data access as its core features in single binary. In our stack, we deployed features independently of each other, to create setup based on microservices and give more control on every tool.
Official documentation: Thanos Metrics
To make it work, we separate Thanos into components:
Sidecar (attached into Prometheus Server Pods).
Store
Querier
Query Frontend
Each component has own configuration based on best practices and observability during work.
Sidecar
The thanos sidecar command runs a component that gets deployed along with a Prometheus instance on every Kubernetes cluster. This allows sidecar to optionally upload metrics to object storage and allow Queriers to query Prometheus data from local storage.
As object storage, we use AWS S3 bucket deployed on an AWS Common account.
Store
Store Gateway (thanos store command) implements the Store API on top of historical data in an object storage (AWS S3 bucket). It joins a Thanos cluster on startup and advertises the data it can access. It keeps a small amount of information about all remote blocks on own local storage and keeps it in sync with the bucket. This data is generally safe to delete, makes restarts safe.
In our setup, we have got two instances of Thanos Store, to achieve high availability of this component. There is no autoscaling.
In our setup, we’re using Index Cache based on AWS ElastiCache Redis cluster to speed up posting and series lookup from TSDB blocks indexes.
Querier
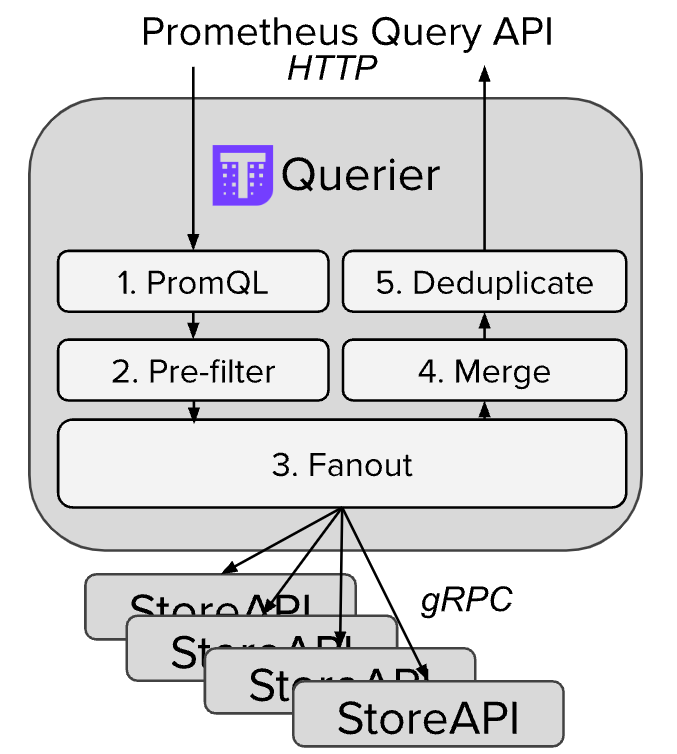
Querier (thanos query command) implements the Prometheus HTTP API to query data in a Thanos cluster via PromQL. It gathers the data needed to evaluate the query from underlaying StoreAPIs (Thanos Stores and Thanos Sidecars components), evaluates the query and returns the result.
Querier is fully stateless (so restart safe) and horizontally scalable (and we implement HPA because of that).
Querier HPA configuration:
Min instances | Max instances | Scaling target |
|---|---|---|
2 | 4 | CPU: 75% |
This component also merges and deduplicates data during a query. The image below shows its flow:

To explore data on Querier you need to use Web Interfaces exposed with Query Frontend.
Query Frontend
Query Frontend (thanos query-frontend command) implements a service that can be put in front of Thanos Queriers to improve the read path.
Query Frontend is fully stateless (so restart safe) and horizontally scalable (and we implement HPA because of that).
It supports caching query results and reuses them on subsequent queries. If the cached results are incomplete, Query Frontend calculates the required subqueries and executes them in parallel on downstream queriers. Currently, we’re using AWS ElastiCache Redis cluster for this.
Query Frontend HPA configuration:
Min instances | Max instances | Scaling target |
|---|---|---|
2 | 8 | CPU: 75% |
This is the component you see after connect into Prometheus Web Interface.