Infrastructure documentation: Grafana
Revision | Date | Description |
|---|---|---|
| 24.07.2024 | Init Changelog |
Introduction
The purpose of this document is to provide comprehensive documentation of the infrastructure for the Grafana Instance. This documentation aims to serve as a detailed guide for system administrators, DevOps / SRE Engineers, and other stakeholders involved in the deployment, maintenance, and management of Grafana Instance. It covers all aspects of the system, including architecture, installation, configuration, monitoring, security, backup, and troubleshooting.
System Architecture
Basic information
Parameter | Value |
|---|---|
Environment | Production |
Version | v10.4.1 |
Host | grafana.blue.pl |
SSL |
|
Infrastructure | EKS |
Deployment Automation |
|
Storage | PostgreSQL |
Backup |
|
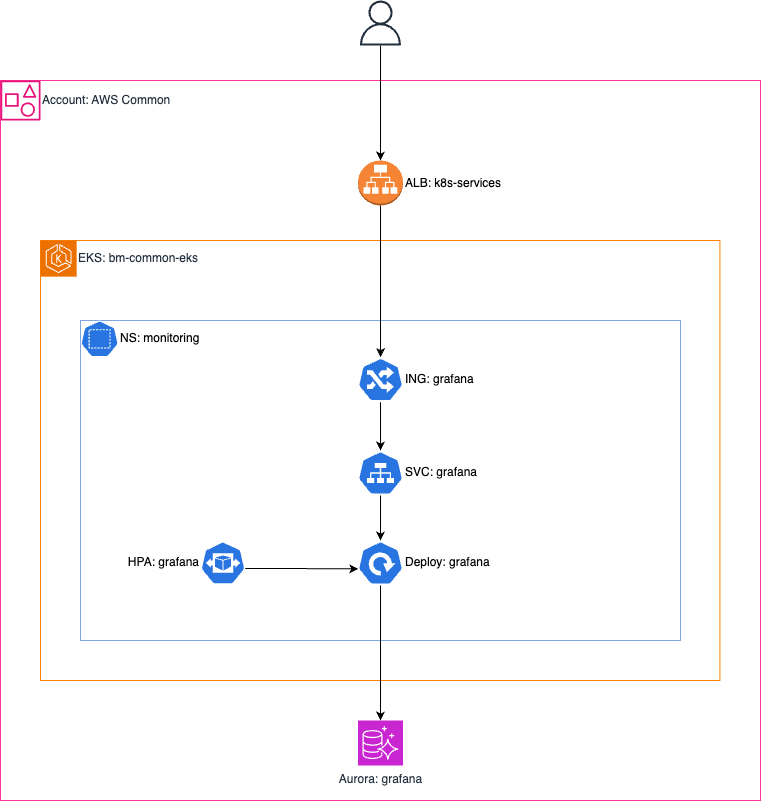
Architecture diagram

Component descriptions
AWS
ALB - Dynamically created from Kubernetes (ALB Ingress Controller). Configuration managed by controller and Ingress annotations.
EKS - Shared with other applications running on this EKS Cluster, managed outside of the Grafana infrastructure.
RDS Aurora - A PostgreSQL-based database serving as storage for the Grafana instance.
Kubernetes
Ingress - manages external access to services within a cluster, redirects User from HTTP protocol into HTTPS.
Service - offers stable IP and hostname for communication within the cluster. In conjunction with Ingress resource, allow for redirection of users to application pods.
Deployment - manages the creation and scaling of application pods, ensuring the desired number of instances are running.
Horizontal Pod Autoscaler (HPA) - automatically adjusts the number of replica pods in a deployment based on observed CPU utilization.
Runtime Environment
Parameter | Value |
|---|---|
Cloud Provider | AWS |
Infrastructure Delivery | |
Orchestrator | Kubernetes (EKS) |
Cluster | [ AWS ] [ EKS ] BM-COMMON |
Node OS | Amazon Linux 2 |
GitOps | FluxCD |
Installation and Configuration
AWS
To install Grafana on EKS cluster, first, it is necessary to create the required resources on AWS (database and IAM roles with permissions for the application). To do this, follow the instructions below:
Prepare Terraform project:
Create backend and provider configuration.
Init Terraform project.
Setup variables for sensitive data used in Terraform files.
Load data into terraform.
(optional) Prepare tags for created resources.
Create
securityGroupfor Database with access for master users and Grafana applcation (deployed on EKS) - port5432.Add AWS KMS configuration for database encryption.
Define database resource.
Verify resources.
Kubernetes
To install Grafana Application, follow steps below:
Create
helmrepository.yamlfile:apiVersion: source.toolkit.fluxcd.io/v1beta2 kind: HelmRepository metadata: name: grafana spec: interval: 60m0s url: https://grafana.github.io/helm-chartsCreate
helmrelease.yamlfile:apiVersion: helm.toolkit.fluxcd.io/v2beta1 kind: HelmRelease metadata: name: grafana spec: interval: 5m chart: spec: chart: grafana version: <version> sourceRef: kind: HelmRepository name: grafana valuesFrom: - kind: ConfigMap name: grafana-helm-values valuesKey: values.yamlCreate
values/values.yamlfile and configure Helm Chart with your values.(optional) Create extra configuration files, like
config/ldap.tomlorconfig/.envfile.Create
kustomization.yamlfile and connect all files:apiVersion: kustomize.config.k8s.io/v1beta1 kind: Kustomization configMapGenerator: ## Generate ConfigMap for Helm Chart values to use in HelmRelease resource. - name: grafana-helm-values files: - values/values.yaml secretGenerator: ## Secret that contains Extra Configuration files for Grafana Instance - name: grafana-extra-configs options: ## disable suffix hash for secret, because it is used as value in Helm Chart Values ## Dynamic names don't work with this. disableNameSuffixHash: true files: - ldap-toml=config/ldap.toml ## Secret that contains ENVs for Grafana Container, like Database Config - name: grafana-sensitive-configs options: ## disable suffix hash for secret, because it is used as value in Helm Chart Values ## Dynamic names don't work with this. disableNameSuffixHash: true literals: - DB_HOST=<database_address> - DB_NAME=<database_name> - DB_USER=<database_user> - DB_PASSWORD=<database_password> resources: - helmrelease.yaml - helmrepository.yaml
Configuration
LDAP
Grafana can be configured to use LDAP for user authentication. To do this:
Create a file named
ldap.tomlwith LDAP configuration (example):[[servers]] # Ldap server host (specify multiple hosts space separated) host = "ldap.my_secure_remote_server.org" # Default port is 389 or 636 if use_ssl = true port = 636 # Set to true if LDAP server should use an encrypted TLS connection (either with STARTTLS or LDAPS) use_ssl = true # If set to true, use LDAP with STARTTLS instead of LDAPS start_tls = false # The value of an accepted TLS cipher. By default, this value is empty. Example value: ["TLS_AES_256_GCM_SHA384"]) # For a complete list of supported ciphers and TLS versions, refer to: https://go.dev/src/crypto/tls/cipher_suites.go tls_ciphers = [] # This is the minimum TLS version allowed. By default, this value is empty. Accepted values are: TLS1.1, TLS1.2, TLS1.3. min_tls_version = "" # set to true if you want to skip SSL cert validation ssl_skip_verify = false # set to the path to your root CA certificate or leave unset to use system defaults # root_ca_cert = "/path/to/certificate.crt" # Authentication against LDAP servers requiring client certificates # client_cert = "/path/to/client.crt" # client_key = "/path/to/client.key" # Search user bind dn bind_dn = "cn=admin,dc=grafana,dc=org" # Search user bind password # If the password contains # or ; you have to wrap it with triple quotes. Ex """#password;""" bind_password = "grafana" # We recommend using variable expansion for the bind_password, for more info https://grafana.com/docs/grafana/latest/setup-grafana/configure-grafana/#variable-expansion # bind_password = '$__env{LDAP_BIND_PASSWORD}' # Timeout in seconds. Applies to each host specified in the 'host' entry (space separated). timeout = 10 # User search filter, for example "(cn=%s)" or "(sAMAccountName=%s)" or "(uid=%s)" # Allow login from email or username, example "(|(sAMAccountName=%s)(userPrincipalName=%s))" search_filter = "(cn=%s)" # An array of base dns to search through search_base_dns = ["dc=grafana,dc=org"] # group_search_filter = "(&(objectClass=posixGroup)(memberUid=%s))" # group_search_filter_user_attribute = "distinguishedName" # group_search_base_dns = ["ou=groups,dc=grafana,dc=org"] # Specify names of the LDAP attributes your LDAP uses [servers.attributes] member_of = "memberOf" email = "email"Create a
Secretcontaining the previously created file.In the
values.yamlfor the Helm Chart, enable LDAP:ldap: enabled: true existingSecret: grafana-extra-configsIn the
values.yaml, in thegrafana.iniconfiguration section, enableauth.ldapand specify the configuration:grafana.ini: auth.ldap: enabled: true allow_sign_up: true config_file: /etc/grafana/ldap.toml
Plugins
To install plugins for Grafana during its startup, you should specify their names in the values.yaml file for Helm Chart as the value for one of the parameters. See the example below:
In case of using persistent storage for Grafana, you can safely install plugins in the Web GUI without risking their configuration loss.
Datasources
Configuration of datasources in Grafana can be done during instance startup. To do this, they should be configured appropriately in the values.yaml for the Helm Chart. See the example:
In the case of using persistent storage for Grafana, you can install them from the Web GUI without risking their configuration loss.
Cloudwatch Datasource
To ensure the AWS CloudWatch plugin works correctly and has the necessary permissions, you can create an IAM Role that can be assumed by the ServiceAccount attached to the Grafana application pods. Here’s how you can do it:
Note down the
OIDC IssuerURL and ARN for the EKS cluster where Grafana is running.Note down the name of the
NamespaceandServiceAccountassociated with Grafana pods.Create a Terraform file (
iam.tf) and define policies with an IAM Role:Note: Replace <oidc_issuer_arn>, <grafana_namespace>, and <grafana_service_account> with the actual values corresponding to your EKS cluster and Grafana setup.
data "aws_iam_policy_document" "assume_role" { statement { effect = "Allow" actions = ["sts:AssumeRoleWithWebIdentity"] principals { type = "Federated" identifiers = [<oidc_issuer_arn>] } condition { test = "StringEquals" values = ["system:serviceaccount:<grafana_namespace>:<grafana_service_account>"] variable = "${replace(<oidc_issuer_url>, "https://", "")}:sub" } } } data "aws_iam_policy_document" "policy" { statement { effect = "Allow" actions = ["sts:AssumeRole"] resources = ["*"] } } resource "aws_iam_role" "grafana" { name = "grafana" assume_role_policy = data.aws_iam_policy_document.assume_role.json } resource "aws_iam_role_policy" "grafana" { role = aws_iam_role.grafana.id policy = data.aws_iam_policy_document.policy.json }Apply it on AWS Account where AWS EKS with Grafana is deployed.
Get ARN of created IAM Role.
On Kubernetes Cluster, create
ServiceAccountfor Grafana pods with annotation (if role already exists, just add annotation to it):eks.amazonaws.com/role-arn: <iam_role_arn>Restart Grafana pods.
On the AWS account from which you want to retrieve CloudWatch metrics, create a new IAM Role with the appropriate policies. To do this, you can use the module found in this repository (As the value for
principal_role_arn, specify the ARN of the IAM Role created in the previous steps):module "grafana_monitoring" { source = "../../modules/grafana-monitoring" principal_role_arn = <value> }Install and configure AWS CloudWatch plugin on Grafana using IAM Role from previous step.
Monitoring and Logging
Visualizations
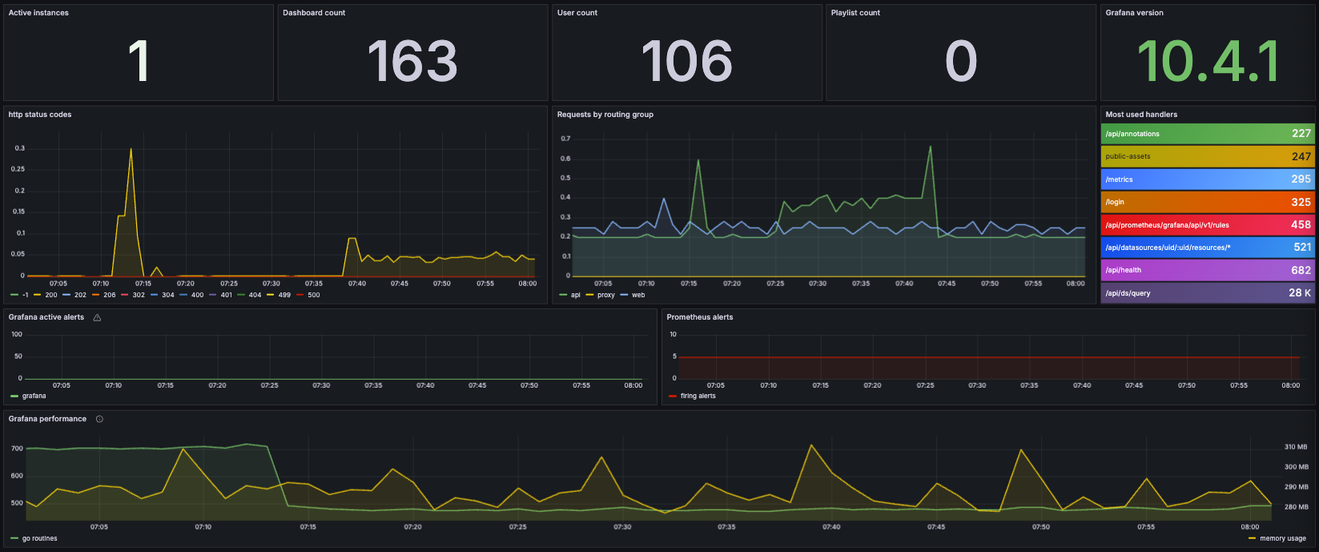
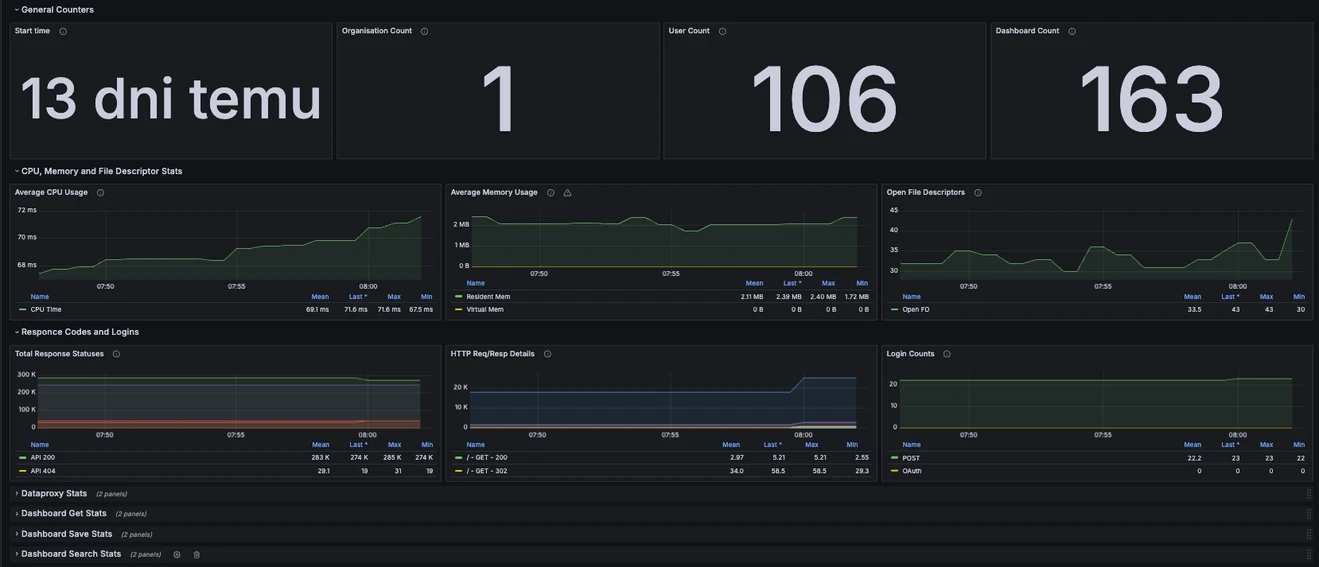
Grafana metrics are collected by Prometheus. This allows for the visualization of data from the instances. For this purpose, two dashboards have been created.
The first one, Grafana, visualizes basic information about the instances (so-called numbers on display).

The second one, Grafana Internals, presents more detailed information useful for monitoring and performance investigation.

Monitoring
In addition to the standard monitoring of the Kubernetes cluster, which includes Grafana resources, there is also service availability monitoring in Zabbix.
Logging
Logs are available from the pods on the Kubernetes cluster. After several years of working in the organization, I still do not have the addresses/access to the ELK where I could verify the availability of logs (though they should be in some).
User Management
On the production instance of Grafana, user login is enabled using LDAP (ActiveDirectory).
Below is a description of the group-to-role mapping:
LDAP Group Name | LDAP Group DN | Grafana Role |
|---|---|---|
|
|
|
|
|
|
|
|
|
Every LDAP user |
|
|
In addition, it is possible to create a user manually from the Grafana panel. The method for adding a user is described in the official documentation: Create users and teams | Grafana Labs.
Backup Management
Grafana saves its configuration, alerts, dashboards, etc., as JSON files on attached storage. In the case of production instance, this is an AWS Aurora PostgreSQL database. This database is attached to the default backup policy for the AWS Common account through the AWS Backup service.
More information about database backup policies in AWS, their restoration, and monitoring of the process can be found on the following pages:
[RDS & Aurora Backup] (https://bluemedia.atlassian.net/wiki/spaces/D/pages/2090106882)
Updates and Maintenance
Docker Image
Due to the imposed rate limits on downloading images from Docker Hub, the base image for Grafana is copied to the organization’s Registry. The Dockerfile and Registry are located in this repository.
Update Image
Modify the version in the
Dockerfileresponsible for the Grafana image.Push the changes to the repository.
Wait for the CI/CI process to complete.
Helm
The production Grafana instance is managed using the official Helm Chart and FluxCD. This means that all updates are performed using these tools.
Deploying a High Availability configuration allows for updates without any downtime of the panel.
All YAML manifests are available in this repository.
Update Repository
FluxCD automatically refreshes information about the Grafana Helm repository at a set interval (check HelmRepository resource / manifest). However, to manually refresh the resource before the scheduled time, you need to execute the command with the appropriate EKS cluster context selected where the resources are located:
Update App via Helm Release
To update Grafana to a newer version, you need to modify the HelmChart version in the HelmRelease using FluxCD. Make the changes in this file: link.
After pushing the changes to the remote repository, monitor the state of the EKS cluster. Shortly after the commit, the Grafana pods should start a Rolling Update.